


Product
Templates
Resources
Company
Infographic Maker
Transform complex data and information into visually impactful, easy-to-understand infographics with Kittl's free infographic maker. Whatever subject matter you're looking to present, our intuitive infographic creator offers a wide range of customizable templates and design elements to help you create stunning infographics in minutes.
Trusted by designers at

Create professional, custom infographics with ease
Whether you’re presenting research findings, creating marketing materials, or completing a school project, with our infographic maker, you can do it all. No need to spend months learning complicated design software — simply choose from our templates and add your information to create a custom infographic with just a few clicks.
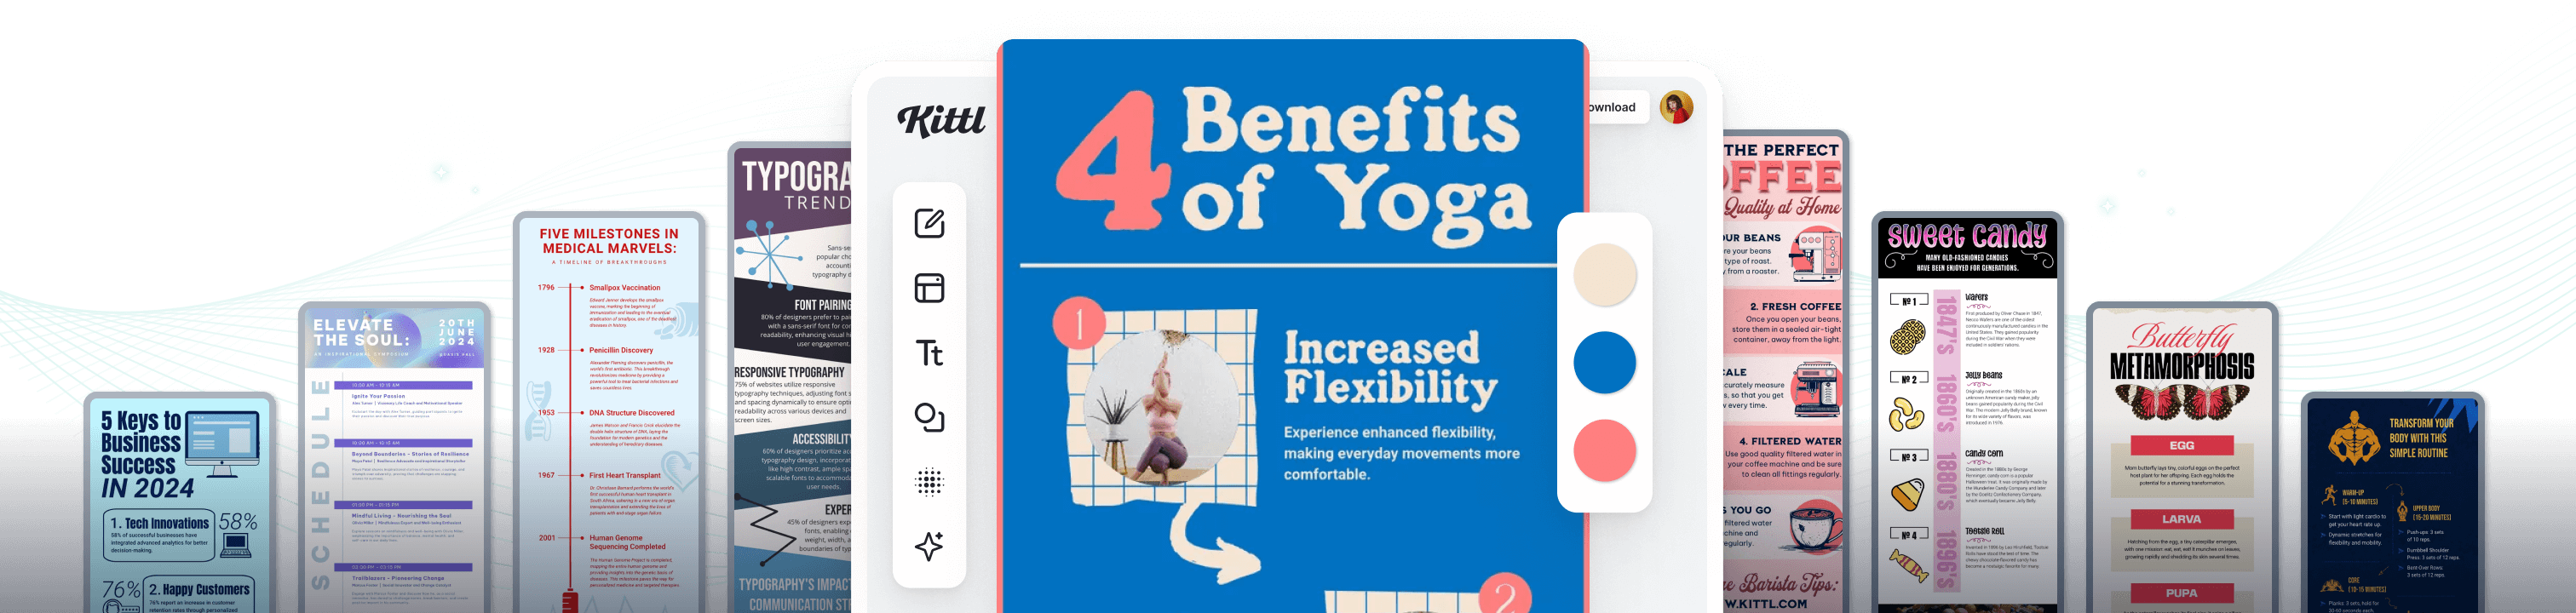
Transform mundane numbers into visually appealing graphics which are easy to understand and leave a lasting impression on your audience. Whether you’re presenting statistical information, survey results, or trends, you’ll be able to find the perfect starting template from our infographic template library. All our templates are completely customizable allowing you the ability to create a professional-looking infographic for business or to use in the classroom with ease.
When using our infographic creator, you have full control over every aspect of your design, from text styles to backgrounds, ensuring your infographic stands out and aligns with your branding. Add icons, shapes, symbols to represent key data points or to highlight important milestones in an infographic timeline. Upload your own images and seamlessly integrate them into your infographic. Arrange and customize elements to your heart’s content - play around with fonts, colors, text effects and layouts until you’re satisfied with the result.
Share your infographic digitally by sending it via email, posting it on social media platforms like Twitter, Facebook, or LinkedIn, or feature it in your next marketing meeting. Embed your infographic into blog posts to engage your audience and encourage them to explore more of your content. Want to take it offline? No problem – simply print out your infographic and include it in your presentations, display at events, or distribute as handouts. Get ready to create impactful infographics that showcase data, tell compelling stories, and drive traffic to your site.
How to create infographics
1. Open the editor
Open Kittl on your desktop browser, then click on “New Project” in the top right.
2. Find the right template
Discover a wide range of professionally crafted infographic templates tailored to various topics and styles.
3. Customize your infographic design
Personalize your chosen template by adding your data, changing colors, fonts, and layout to suit your message and branding.
4. Download, share, or print
Download your infographic to share digitally, include it in your marketing materials or print it for presentations.
Browse Infographic Templates
Loading
Loading
Choose a template and create stunning infographics with just a few clicks
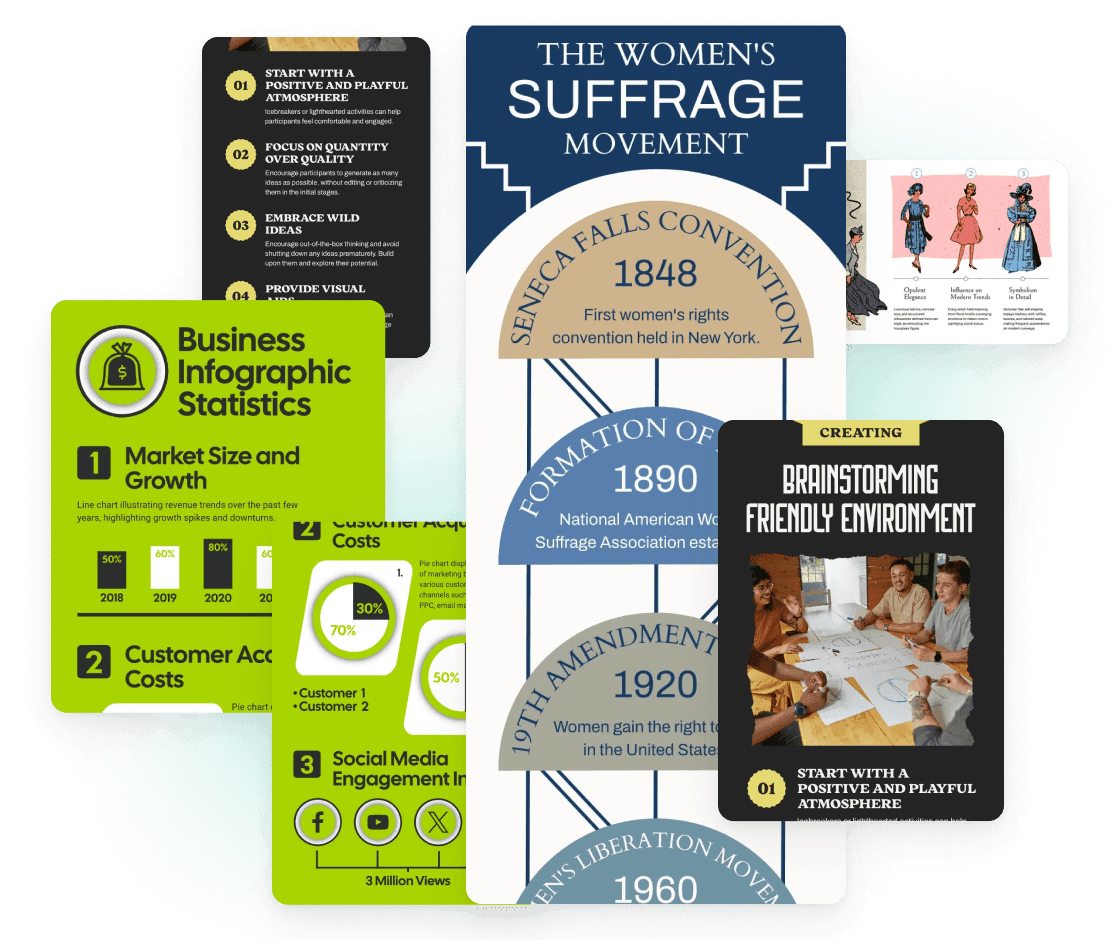
Our infographic generator has a diverse selection of templates professionally designed for every purpose, style, and type of data imaginable. Whether you’re visualizing statistics, sharing educational content, or explaining abstract concepts, our templates provide the perfect starting point. Our meticulously crafted layouts are not only visually stunning but also thoughtfully structured to guide your readers through information seamlessly, making complex data easy to understand and engaging.
Turn your data into an exciting story with beautiful graphics and text
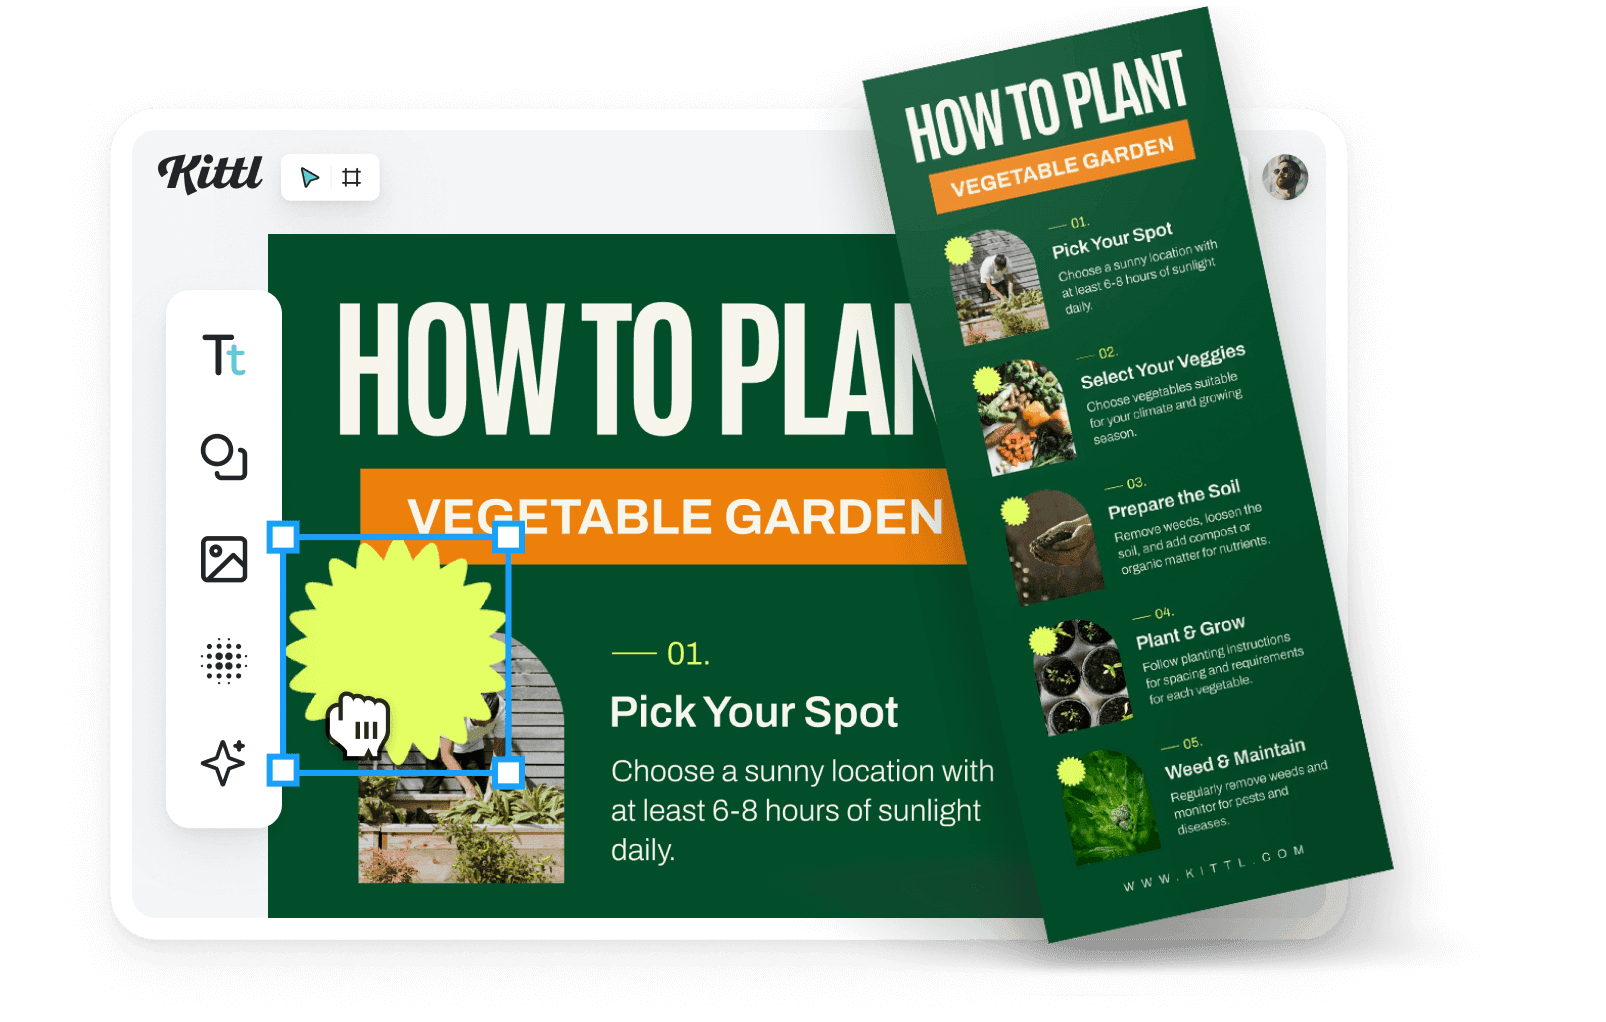
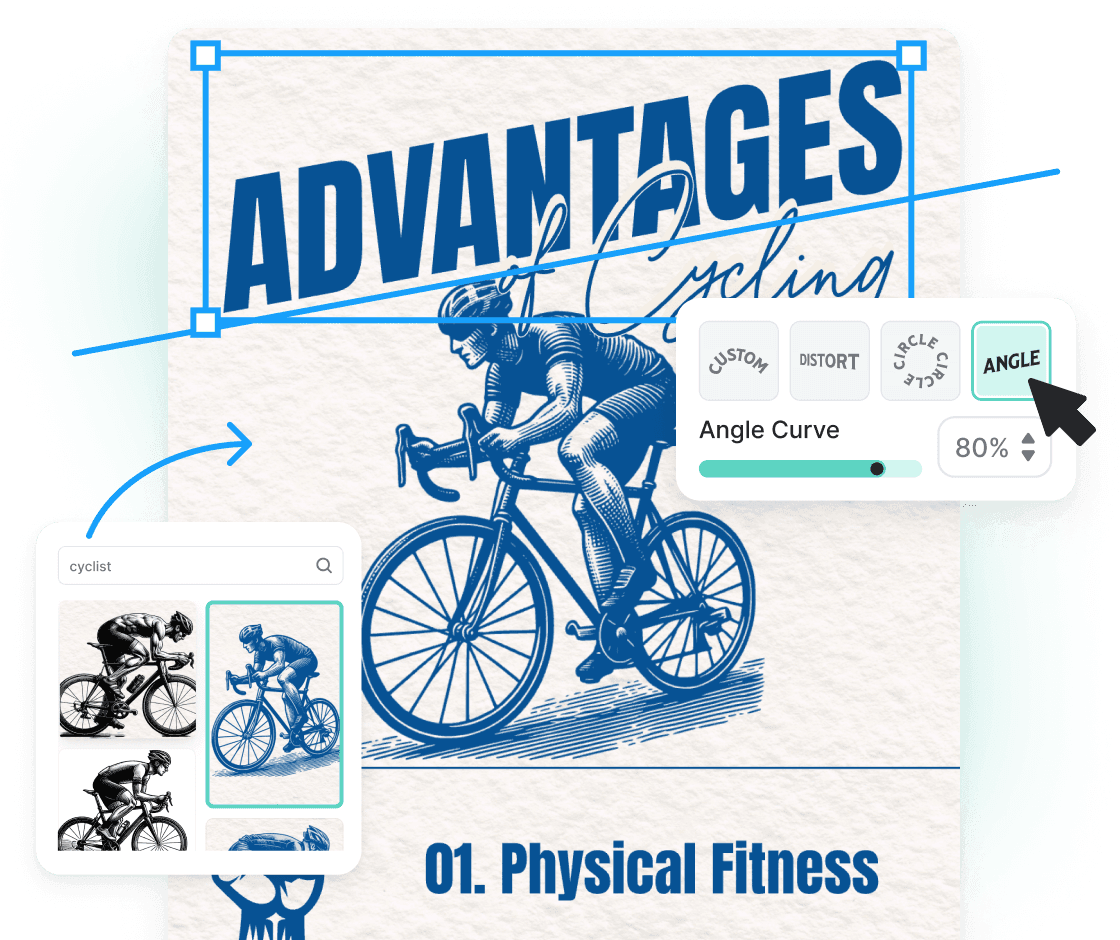
Add visual interest with icons, illustrations, and symbols. Place these elements thoughtfully throughout your infographic to guide the viewer’s eye and emphasize key points. Experiment with vibrant colors and typography to create contrast or draw attention to important information. You can also upload your own images or choose from our extensive stock library to complement your data and ensure your design resonates with your target audience.

Captivate your audience with engaging infographics across channels
Share your infographic via email to reach specific segments or leverage various social media platforms to extend your reach and engagement. Infographics make excellent marketing material for blog posts, where they can visually enhance the readability of your content and increase reader interest. You can even print your infographic design to display at events, include in presentations, or distribute as handouts.
“I just keep saying it's dope. You can create complex designs very easily.“
Rich Khun
230k+ subscribers
“I’ve really enjoyed creating some stunning designs!“
Will Paterson
850k+ subscribers
“Kittl makes creating new designs super easy.“
Odetta Rockhead-Kerr
1.22M+ subscribers
Explore Similar Topics
Frequently Asked Questions
What makes a good infographic?
A good infographic design clearly and attractively presents information. It needs a straightforward message backed by relevant data and visuals like charts, graphs, icons, and images. The layout must be organized to lead the viewer's eye through the information smoothly.
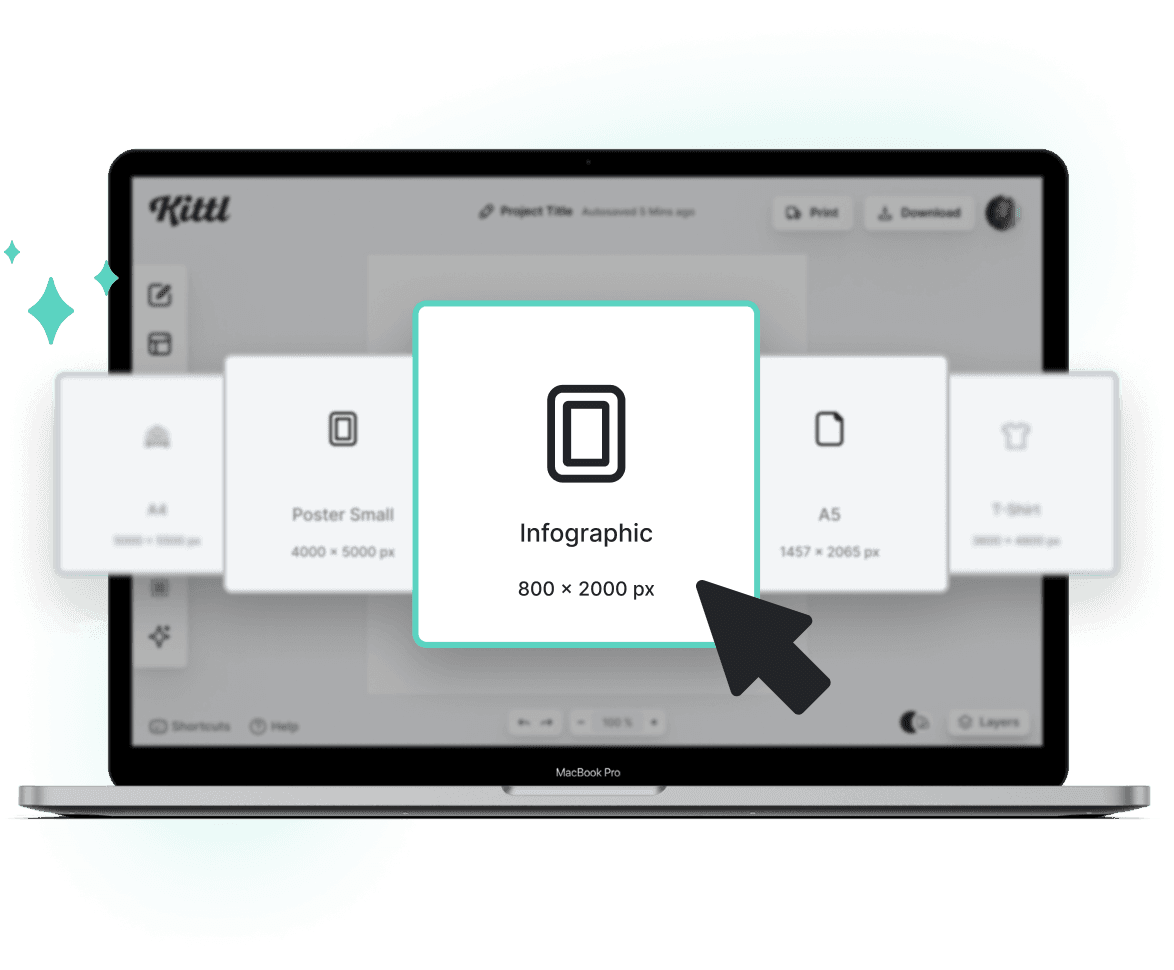
What is the best size for an infographic?
Choosing the right size for an infographic depends on its intended use. For blogs, 663 x 2000 pixels work best to fit within articles. On Facebook, opt for 1200 x 628 pixels, while for LinkedIn, 1104 x 736 pixels is ideal.
When creating print materials, the usual sizes for infographics are standard paper sizes such as letter (8.5 x 11 inches) or poster sizes like A3 (11.7 x 16.5 inches) and A2 (16.5 x 23.4 inches). Our infographic maker lets you easily adjust the dimensions to meet your specific requirements.
What types of infographics can I make with Kittl?
You can make infographics of any kind to meet your needs. Whether for information, stats, processes, comparisons, timelines, or maps, we offer customizable templates and simple tools to help you realize your vision. Check out the options and pick the best one that fits your content and audience.
How do I display data in my infographic?
You can incorporate data by using our icons, shapes, and graphics library to represent different data points and trends. Simply choose the appropriate graphic element, customize its appearance to match your infographic’s style, and insert it into your design.
Can I use Kittl for free?
Absolutely! Kittl offers a free plan accessible to everyone, enabling you to design, download, and share your creations with access to our template library. For additional benefits such as full commercial licensing, vector downloads, and AI generation, Kittl offers paid plans with advanced features.
Can I use Kittl for commercial projects?
Yes, you can! If you’re on a free plan, you need to credit Kittl but if you are using a paid plan, you are free to use Kittl without any credit. To find out more about our commercial licensing, click here.
Create stunning infographics with just a few clicks